There are several different ways to measure or define the success of a website. Different websites use different metrics to do the same. Blogs usually refer to the page views or unique visits while an E-Commerce site refers to the revenue generated. A social media site like Facebook or Twitter might use daily active user count in addition to the customer sign up. A forum or bulletin board could use unique thread or post counts as a measure of success.
User engagement is one of the important factors that can measure the success of a website. But unfortunately it is a really broad term that could mean any of the analytic metric or sometimes even a combination of several of them. The exact metric that captures the user engagement for a particular website would depend very much on the type of the site itself.
Define User Engagement
The first thing to do is to define what user engagement is in the context of a particular or specific website. What kind of website do you have and what do you want the visitor to the website ideally do? Do you want them to purchase a product, or share content on social media, or post comments, read articles or something else?
Once you have defined the ideal visitor interaction, then you can go about identifying the exact web analytics metric that captures this user interaction. It can be one metric or may be a collection of several different metrics. Sometimes, it is not uncommon that you might have to further define the metric or might have to quantify the metric itself. We will see how you do that later.
As an example, let’s say that you have a social media website something similar to Google+ or Facebook. One metric that is usually quoted is the daily active users. You will now need to define what an active user is. It can be an user who just logged into the site on the day or it can be defined as somebody who read at least one post or somebody who made at least one new post. It is this finer definitions that make the metric look good…
We will look at several commonly used web metrics that are used to quantify user interaction. One or more of them might be relevant in your case…
Page Views per Visit
This measures how many pages were viewed by the user during a visit to the website. The general idea is that if the user is interested and engaged then he or she would visit several pages and spent some time on the website. This is a good indicator of user engagement for many different types of websites.
Bounce Rate
This is a similar metric to the above mentioned Page views per visit. It measures the percentage of visitors who left the site without visiting more than one page. A lower bounce rate is indicative of an engaged audience. But this can also be a misleading metric and should be used or interpreted in conjunction with other metrics for a complete picture.
Returning Visitors
This metric measures what percentage of your visitors are return or repeat visitors. For most websites (not all though) repeat visitors are deemed to be a good or positive measure of user engagement. It generally means that the user found your site to be engaging enough to visit again (and again) over several days.
Visitor Recency
This is a metric that builds on the previous Return Visitor metric. How often does the repeat visitors return to your site? Is it everyday, once or week or once a month. The visitor recency measures if the current visit is the first visit for the user and if not how recently did they visit before this one?
Session Duration
This metric calculates the time spent on the website by the user during a visit. It is quite possible that the visitor spent all his time reading a single article or page, but did spend considerable amount of time do so which is a good thing. The Page Views and Bounce Rate metrics will not capture this use case, although this interaction could be considered a positive one.
Conversion or Revenue
If your website is meant to sell products or services directly to your customers, then measuring the actual revenue generated would be a good measure of user engagement. Most web analytic products gives you the ability to create custom metrics to measure things such as the revenue generated.
In addition to the above mentioned widely popular user metrics that you can use out-of-the-box (mostly), you can also create custom metrics that define your specific goals.
Custom User Engagement Goals
All the user engagement rules described below are meant to be examples. You should create goals that closely resembles your exact requirements by using these examples as references. What you want to create for your website will be unique to your site. Creating specific goals in Google Analytics with an associated monetary value will give you a better understanding of all of the metrics you want work together.
As an example, let us say that you care about visits or visitors that spend considerable time on your website browsing several different pages (well, who doesn’t?). You also like them to share your content on social media. These are pretty generic goals/metrics for a blog…we will see how you can create a single metric capturing all these using custom goals and events.
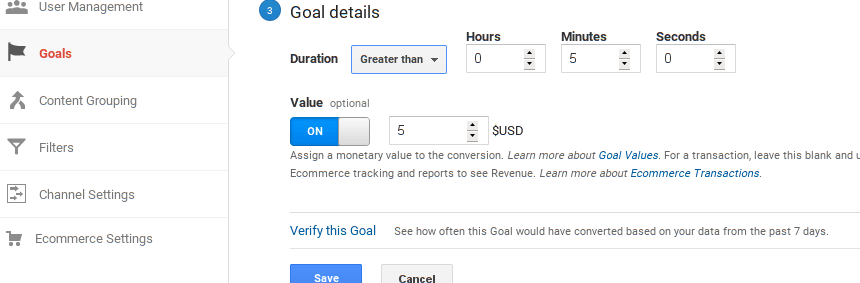
5 Minute Sessions
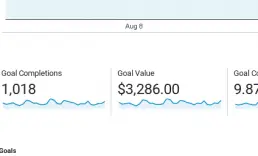
Define a goal that gives a dollar amount (or value) for user visits that stays on the website for 5 minutes or more. The dollar amount that you specify is hypothetical and just denotes a value that it is worth to you for this user engagement. This just puts a value on the Session Duration metric mentioned in the earlier section.
In this example, lets say that it is not that important (relative to other actions) to me how long they stay on the website, so I give it a value of one dollar.
5 Page Views per Visit
Again we create a goal that gives a dollar amount to visitors that browse around and views at least 5 pages in the website. This works the same way as the 5 minute session goal above, but corresponds with the Page View per Visit metric.
It is important that they read more and more content and visit more pages, so i assign a 5 dollar value for this goal.
Social Share
Create a custom event which tracks an user interaction when the content is shared on social media using one of the share buttons on your page. You might want to give a higher value to this action as it has the potential to bring more traffic to your page.
Sharing is very important important to my blog, so i give it a monetary value of 10 dollars.
Once you have all your custom goals and associated values specified, it becomes very easy to see your best performing segments in various reports in Google Analytics. The conversion values are added up nicely and displayed in almost all reports. This gives you a deeper understanding of who your best customers or visitors are and where they are coming from…
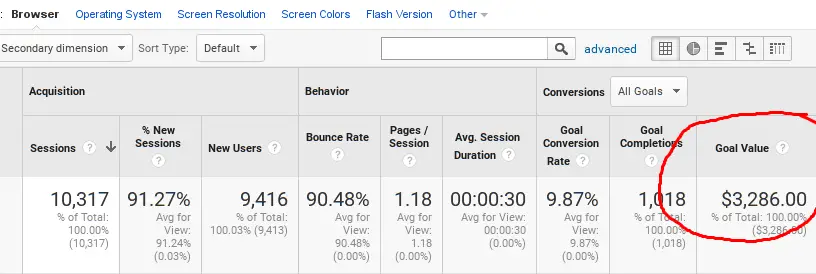
Furthermore, you can also use the conversion data in Google Adwords to target customers that are converting better on your website.